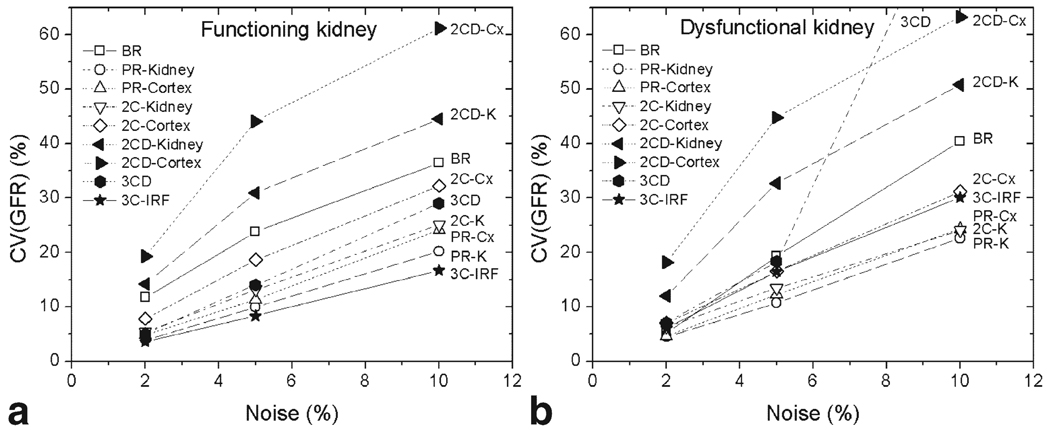
Figure 6.
Coefficient of variation of GFR CV(GFR) at 2%, 5%, and 10% data noise for two kidneys: (a) functioning kidney (GFR = 80.1 mL/min), and (b) dysfunctional kidney (GFR = 18.2 mL/min). The two-compartment models with two or three parameters (PR and 2C) produce lower CV than the five-parameter model (2CD) or BR model. The 3CD model performs well in a normal kidney, yet fails at 10% noise in dysfunctional kidney. In contrast, the 3C-IRF produces the lowest CV(GFR) in healthy kidney and performs comparably with more rigid PR and 2C models in dysfunctional kidney.

