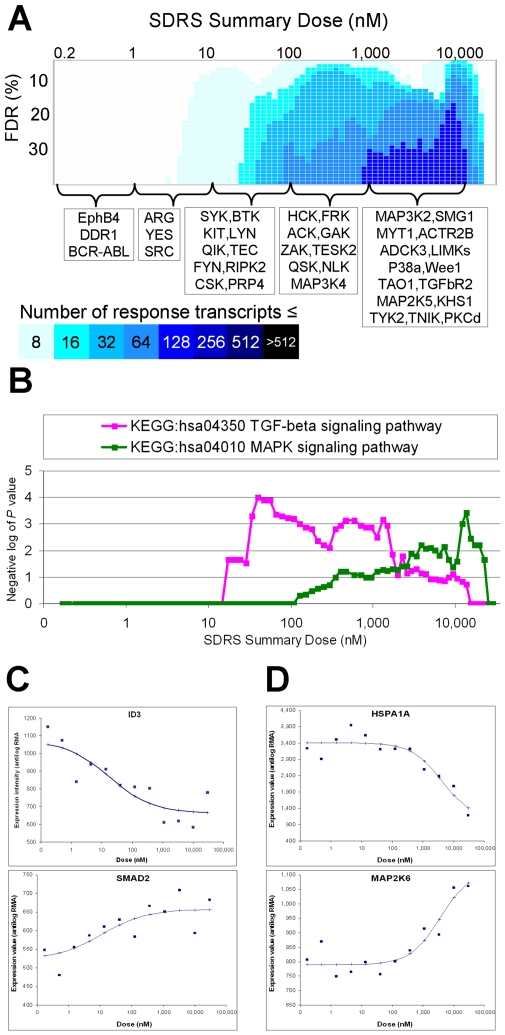
Figure 4. Pathway analysis applied to the transcriptional response to dasatinib at four hours.
(A) Heatmap showing the number of probesets whose F-statistic for goodness of fit to a sigmoidal curve passes the given FDR criterion at each SDRS Summary Dose. Known kinase targets of dasatinib are shown below, with the dose interval for their binding EC50 in cells [41]. (B) Significance values obtained from Fisher's exact tests performed between the lists of gene loci corresponding to response transcripts (1 to 35% FDR), and lists of gene loci representing the three biological pathways indicated. (C) Experimental data for probesets corresponding to ID3 (207826_s_at; EC50 17.5 nM) and SMAD2 (203077_s_at; EC50 10.7 nM) annotated to the TGF-beta signaling pathway (KEGG:hsa04350), with the dose response curves obtained from the optimal model parameters established by SDRS. (D) Experimental data for probesets corresponding to HSP1A1 (200799_at; EC50 3.9 µM) and MAP2K6 (205698_s_at; EC50 3.6 µM) annotated to the MAPK signaling pathway (KEGG:hsa04010), with the dose response curves obtained from the optimal model parameters established by SDRS.

