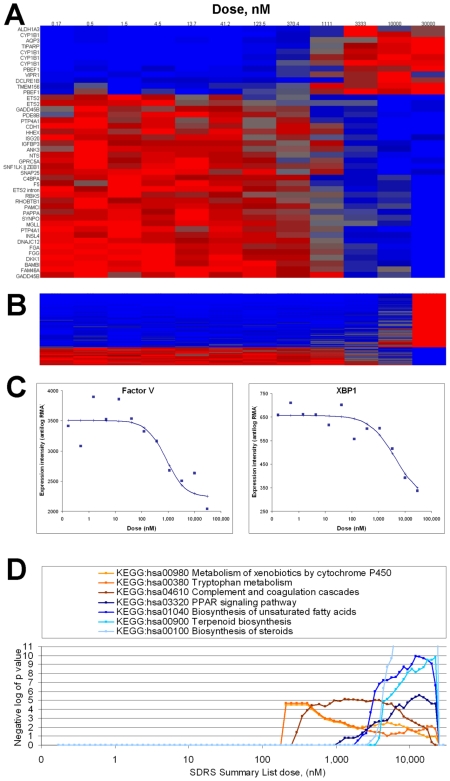
Figure 5. Dose-dependence and pathway analysis of the transcriptional response to imatinib at 20 hours.
(A, B) Signal intensity for 245 SDRS response transcripts (FDR10%, >1.5-fold change; in rows) across twelve doses of imatinib (columns) following 20 hours of treatment. (A) contains the subset of 44 response transcripts with EC50<3 µM. (B) contains the subset of 201 response transcripts with EC50>3 µM. For visualization, RMA signal intensity data was reverse-logged and scaled from zero (blue) to one (red) for each probeset. (C) Experimental data for probesets corresponding to Factor V (204713_s_at; EC50 824 nM) and XBP1 (200670_at, EC50 4.2 µM), with the dose response curves obtained from the optimal model parameters established by SDRS. (D) Significance values obtained from Fisher's exact tests performed between the lists of gene loci corresponding to response transcripts (1 to 35% FDR), and lists of gene loci representing the seven KEGG biological pathways indicated.

