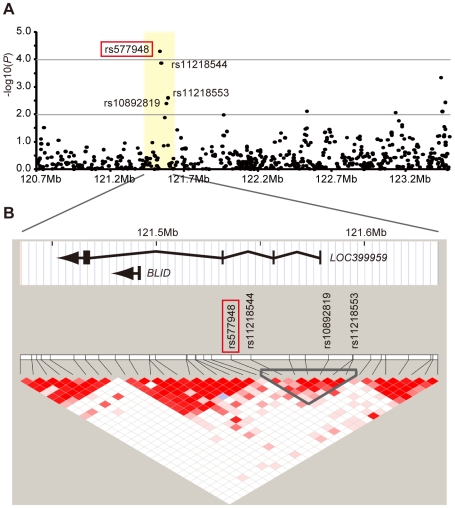
Figure 2. Results of genome scan at 11q24.1 locus containing the BLID and LOC399959 genes.
(A) Adjusted P-values on −log10 scale for SNPs examined for their association by the trend χ2 test. (B) Structures, orientations and locations of the BLID and LOC399959 genes on NCBI Reference Sequence Build 36.1, together with pair-wise LD estimates of the SNP markers located within a 200-kb region encompassing the rs577948 marker (red box). Three additional SNP markers (rs11218544, rs11218553, and rs10892819), that showed adjusted P-value<10−2 in the first stage, are also indicated.

