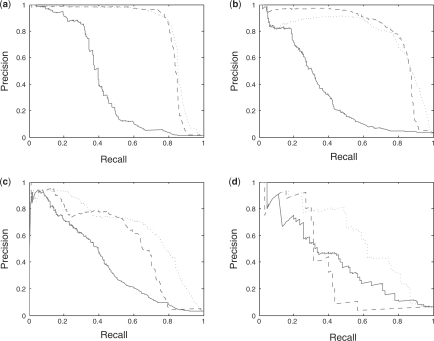
Fig. 1.
PR curves for predicted drug–target interactions using BLMs on four benchmark datasets: (a) enzyme, (b) ion channel, (c) GPCR and (d) nuclear receptor. The solid line is for leave-one-out on potential drugs (row 2 of Tables 1–4), the dashed line for leave-one-out on potential target proteins (row 5 of Tables 1–4) and the dotted line for aggregating the two scores for each putative drug–target interaction (row 8 of Tables 1–4). In the benchmark experiments (a), (c) and (d), the aggregated curve mimics or gives a significant improvement over the other two curves. For ion channels (b), leave-one-out on potential target proteins (dashed line) perform slightly better overall than aggregation (dotted line), but both curves represent extremely strong results.

