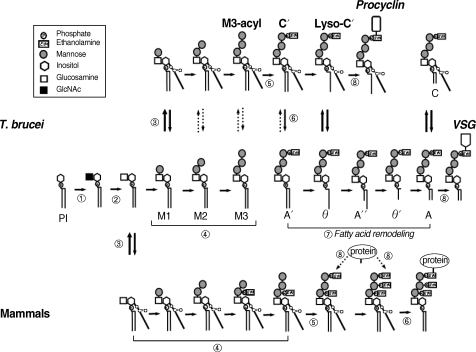
Fig. 2.
The GPI biosynthesis pathways of T. brucei and mammalian cells. The uppermost row indicates the pathway of the procyclic form of T. brucei. The middle row represents the pathway of the bloodstream form and the lowermost row depicts the pathway of mammalian cells. The reactions indicated by the circled numbers (①-⑧) correspond to those described in the text. The involved protein(s) of each step are summarized in Table 1.

