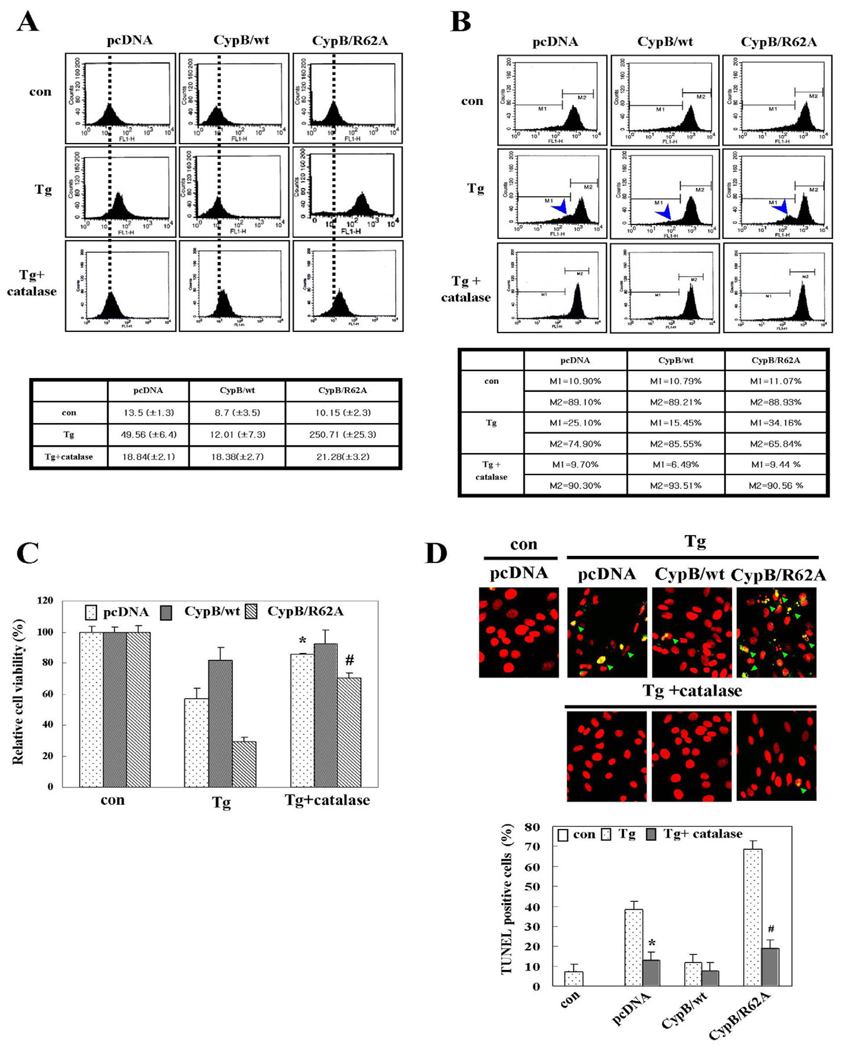
Fig. 5.
Cyclophilin B overexpression suppresses ROS generation, mitochondrial membrane damage and chromosomal DNA fragmentation in response to ER stress. (A) ROS measurement and its quantitative analysis. The dotted line represents the basal level of ROS in cells. Values are means ± s.d. obtained from five independent experiments. (B)MMP measurement and its quantitative analysis. Arrowhead indicates cells with mitochondrial damage. M1 and M2 are cells of damaged and undamaged mitochondria, respectively. (C) Cell viability by MTT assay. Con, untreated; Tg, 1 µM Tg treatment; Tg+catalase, pretreated with 2000 U/ml catalase prior to Tg treatment. The data are means ± s.d. obtained from five independent experiments. *P<0.05 versus Tg-treated pcDNA; #P<0.05 versus Tg-treated CypB/R62A. (D) TUNEL assay and its quantification. The green arrowheads in the top panels indicate TUNEL-positive cells. The data are expressed as the means ± s.d. obtained from five independent experiments. *P<0.05 versus Tg-treated pcDNA; #P<0.05 versus Tg-treated of CypB/R62A.

