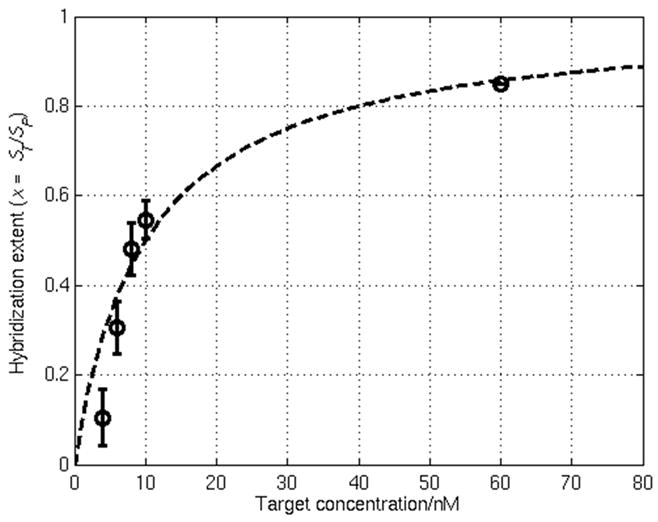
Fig. 4.

Results of a DNA target concentration series using the active CMOS biosensor array in which the hybridization extent x is plotted as a function of the solution target concentration. The dashed line shows the Langmuir fit to this equilibrium isotherm which yields a binding constant Ka of approximately 1×10⁸ M−1. Error bars for the four lowest target concentrations indicate the standard deviation from three separate experiments.
