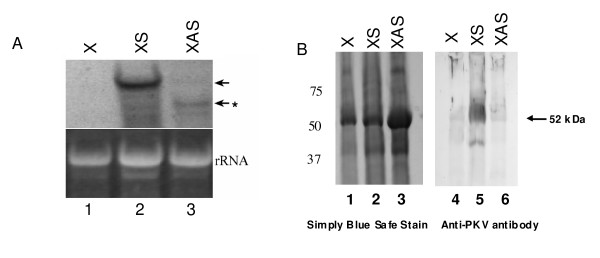
Figure 2.
Characterization of transcript and protein expression in transgenic plants. (A) Northern blot analysis of the accumulation of pkv transcripts in transgenic plants as described in the Methods section. Left panel, 20 ug of total RNA extracted from control (1, X), XS (2) and XAS (3). Ethidium bromide staining of ribosomal RNA (rRNA) is shown to illustrate equal loading of RNAs. Arrows indicate location of mRNAs hybridizing to the PKV DIG-labeled probe. Asterisk indicates degraded PKV transcript in XAS plants. (B) Western blot analysis of PKV protein accumulation in mature leaves of control and transgenic plants using a PKV-specific polyclonal antibody as described in the Methods section. Equal amounts of total protein were loaded per sample lane. Numbers to the left of the figure represent the size of prestained protein markers. Lane 1, X; Lane 2, XS; Lane 3, XAS. The arrow designates the location of the 52 kDa PKV protein.

