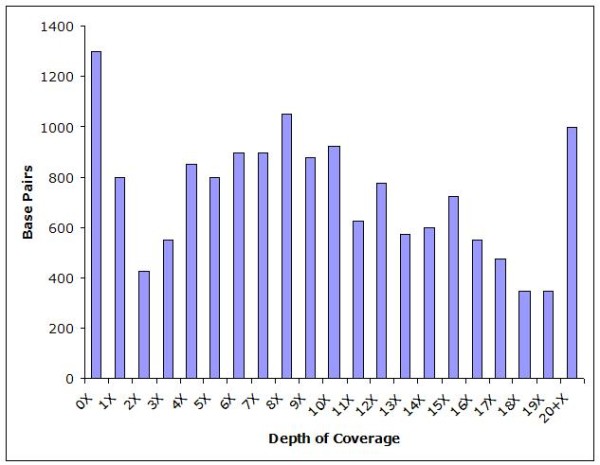
Figure 2.

Sequence Coverage Across the M. scalaris Mitochondrial Genome. The depths of coverage, averaged across 25 bp windows, attained from genome survey sequences of the mitochondrial genome of M. scalaris. The vertical axis represents the number of nucleotide bases with the corresponding depth of coverage.
