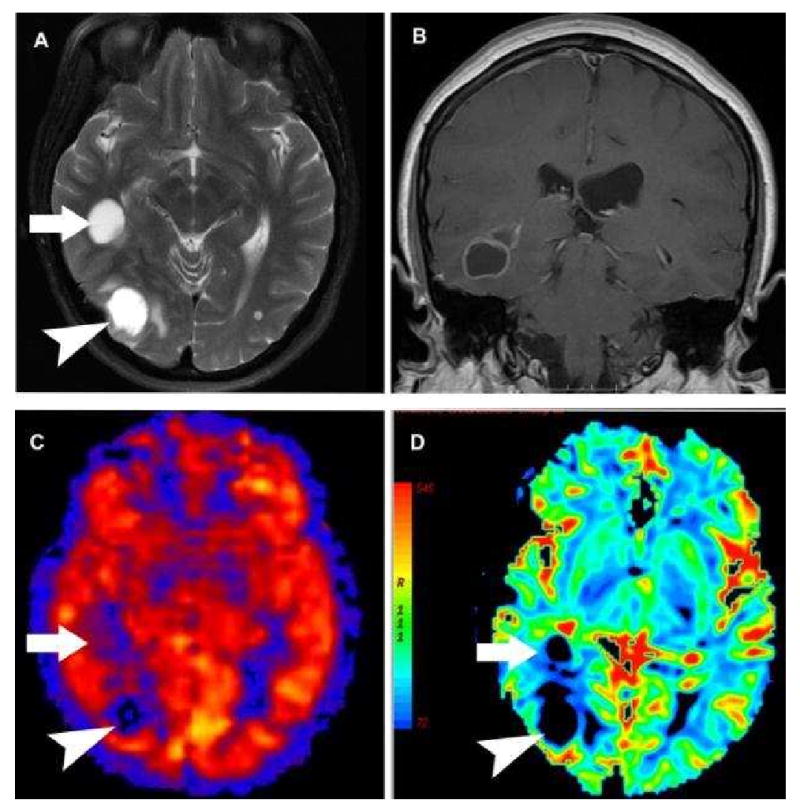
Figure 11.

A-D: Hypoperfused cystic non-small cell carcinoma metastasis on PASL. A) Axial T2 weighted image shows two large hyperintense cystic lesions (arrow and arrowhead) with minimal surrounding vasogenic edema. B) Post contrast coronal image shows smooth ring enhancement of the more anterior lesion. C) PASL CBF map shows both lesions to be significantly hypoperfused relative to grey matter. The more anterior lesion (arrow) is centered within the white matter and is less distinct on PASL. D) Negative Enhancement Integral from a DSC contrast perfusion study shows decreased blood volume in both of the cystic masses.
