
Figure 16. Label panels from Left to Right: A, B, C.
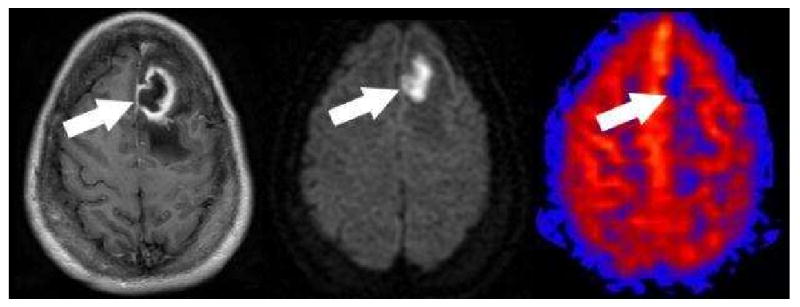
Pyogenic Cerebral Abscess. Post contrast (A) axial T-1 image shows irregular thick ring enhancement with surrounding edema (arrow). The center of the lesion shows homogenous restricted diffusion (B). PASL CBF map (C) shows hypoperfusion corresponding to the center of the lesion (arrow). No hyperperfusion corresponding to the enhancing rim can be identified.