
Figure 17. Label panels from Left to Right: A, B, C.
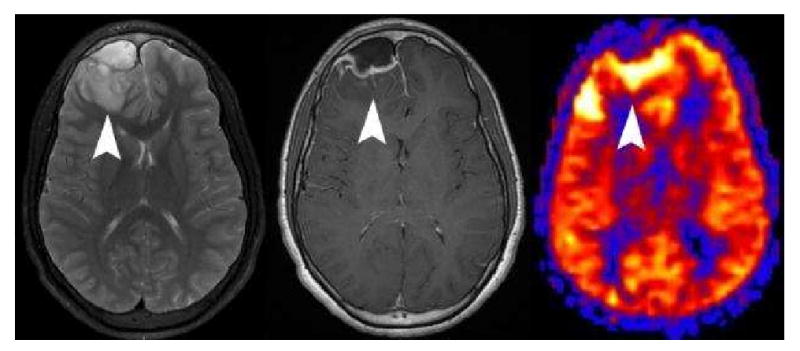
Cerebritis adjacent to an epidural abscess. Axial T2 weighted image (A) shows an epidural fluid collection and adjacent edema (arrowhead) in the right frontal lobe. Post contrast imaging (B) shows a rim enhancing epidural fluid collection, faint enhancement in the adjacent parenchyma (arrowhead), and enhancement of the right frontal subarachnoid spaces. PASL CBF map (C) demonstrates marked hyperperfusion of the edematous cortex (arrowhead).