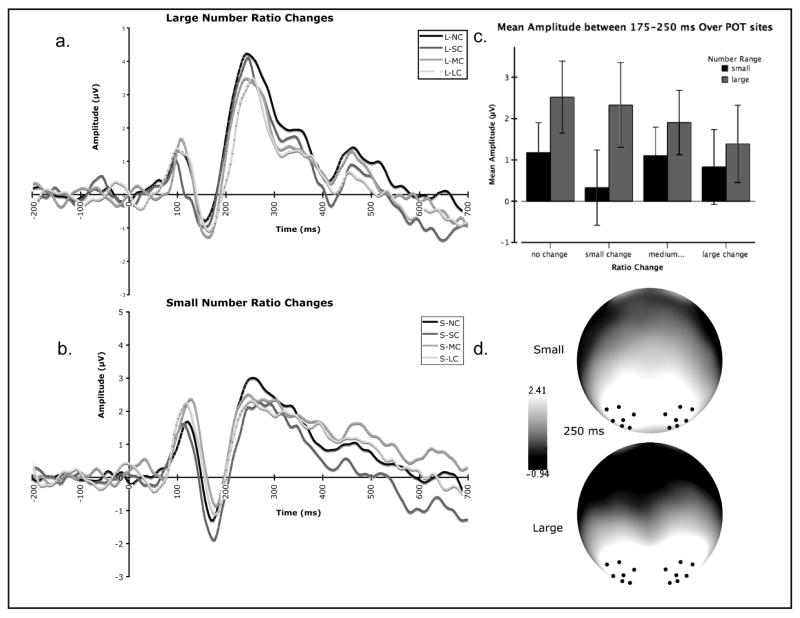
Figure 4.
Summary of the effects of ratio change between adaptation context and test number on event-related potentials in Experiment 1. (a.) Average waveform over POT sites in response to the four ratio change conditions for large numbers (no change, small change, medium change, and large change). (b). Average waveform over POT sites in response to the four ratio change conditions for small numbers (no change, small change, medium change, and large change). (c.) Mean amplitude between 175-250 ms post stimulus onset over POT sites for each ratio change condition (no change, small change, medium change, large change) for each number range (large and small). (d.) Scalp topography at 250 ms characterizing the P2p for both large and small numbers. The black dots represent electrode grouping used for analyses.

