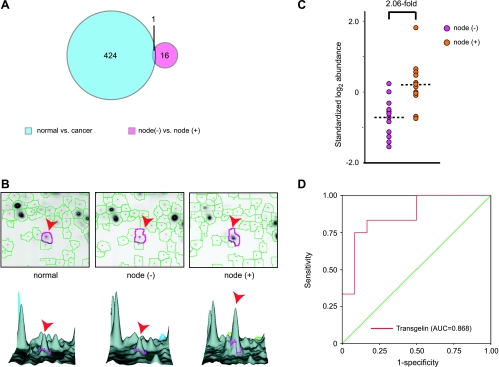
Figure 1.
Proteomic profiling of CRCs stratified by node status. (A) Relationship between biomarkers identified in different comparisons. (B) Differential expression of transgelin. Top: representative two-dimensional gel images; bottom: three-dimensional representation. Arrowheads indicate transgelin. (C) The standardized log-transformed abundance of transgelin in node-negative and node-positive CRC. (D) Receiver operating characteristic (ROC) curve for transgelin in prediction of node status.

