Figure 5.
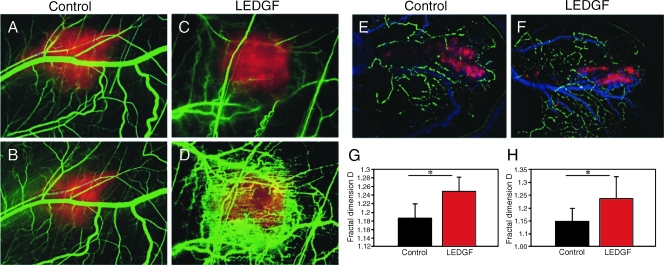
LEDGF-induced remodeling of blood and lymph vessels network. In vivo imaging of H1299 tumors developed in skinfold window chamber (A–D, G). (A–D) Overlay of tumor fluorescence (red) and blood vessels processed using DLSI image (green). Tumors were initiated in the CD-1 nude mice by injecting subcutaneously into a window chamber H1299 cells cotransfected with DsRed and either a control or an LEDGF-encoding plasmid (C, D). Tumor development was followed and imaged 4 (B) and 8 (D) days after tumor cell inoculation. Graph (G) indicates a mean fractal dimension value - D, calculated by fractal box count method [45], represents the complexity of the blood vessels' network. Blood vessels' network induced by the LEDGF-overexpressing tumors is significantly more complex (P = .025). In vivo imaging of C6 tumors developed in the edge of mouse ear (E, F, and H). Overlay of tumor fluorescence (red), blood vessels' DLSI image, and lymph vessels network (green). Tumors were initiated in CD-1 nude mice by injection of C6 cells cotransfected with DsRed and either a control (E) or an LEDGF-encoding plasmid (F). Tumor vasculature was imaged 7 days after cell inoculation. Complexity analysis of the lymphatic network (H) shows the overexpression of LEDGF results in significantly (P = .0194) more complex network.

