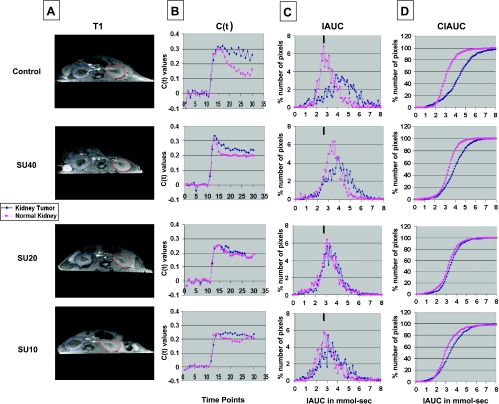
Figure 1.
DCE-MRI of KCI-18 KTs. Mice bearing established tumors in the right kidneys were treated every day for 7 days with vehicle only (control) or with sunitinib at dosages of 40, 20, or 10 mg/kg per day (SU40, SU20, or SU10, respectively). Then, mice were imaged by DCE-MRI for 30 time points at 7-second intervals. (A) Baseline images were collected for the first during 10 time points before Gd contrast agent injection. At time point 10, Gd was injected in the tail vein, and images were collected for 20 more time points. For data analysis, the full kidney was selected as the ROI for the KT (blue contour on left of T1 image) and the contralateral left NK (red contour on right of T1 image). A threshold was selected to remove noise only pixels in the image. (B) The kinetics of Gd contrast uptake are represented in C(t) curves. (C) Data from the C(t) curves were compiled for 16 time points (112 seconds) after Gd injection to draw IAUC112. The small black bar indicates the peak position of NK in control mice and can be used as a reference for curve shifting in NKs and KTs treated with sunitinib. (D) The CIAUC graphs were derived from IAUC curves. In panels B, C, and D, blue lines are for KTs and pink lines are for NKs. Data from a representative mouse from each treatment group are presented.

