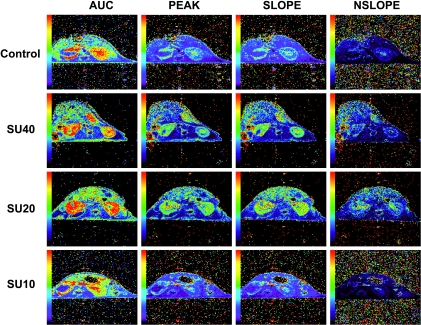
Figure 3.
DCE-MRI of KTs: Parametric color maps. Parametric color maps were constructed based on uptake and concentration of Gd in the tissue, represented by the colors blue, green, yellow, and red with gradual increase of Gd from lowest values (blue) to highest values (red). Data are presented for the same representative mouse from each treatment group shown in Figure 1. The KT is on the left, and the contralateral NK is on the right of the MR images. The color coding in the kidneys are shown for IAUC, the peak, and the slope of C(t). The Nslope represents the clearance of Gd after reaching the peak in the tissue.

