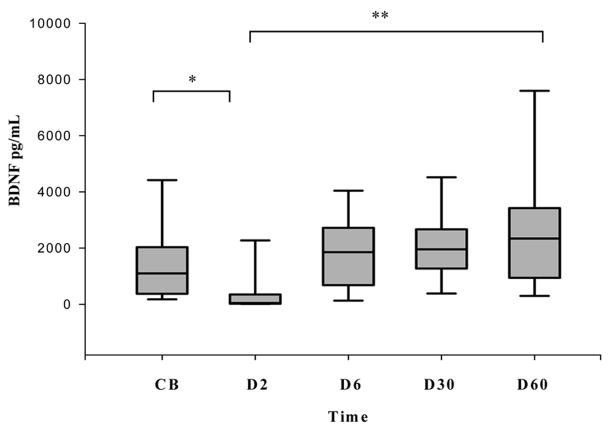
Figure 1.
Serial changes in BDNF levels in preterm infants < 32 weeks gestation. Box plots showing that BDNF levels decline at D2 compared to cord blood but continue to rise thereafter. BDNF levels at D2 were significantly lower than at all other times (*p=0.03, ** p < 0.001 for all comparisons). Data are shown as median (25–75th interquartile range).

