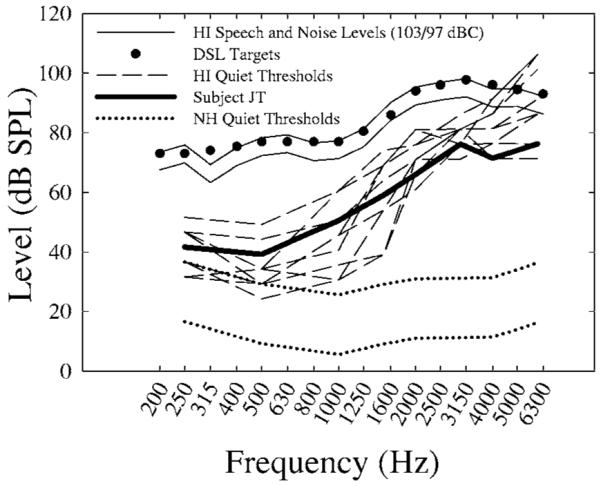
FIG. 1.

1/3 octave band levels (200-6300 Hz) of CST stimuli and DSL targets (filled circles) used in this study. The thin solid lines represent the 1/3 octave band levels of the speech and noise (presented at overall levels of 103 and 97 dBC measured in a Zwislocki coupler). Dotted lines represent a range of thresholds (in dB SPL in a Zwislocki coupler) for our NH control group. These correspond to quiet thresholds of 0 (normal) and 20 dB HL (our screening level for the NH control group). Dashed lines represent quiet thresholds for HI subjects listening to the speech at 103 dBC. The dark solid line represents threshold for HI subject JT, who listened to the speech and noise at a level of 94 and 88 dBC, respectively.
