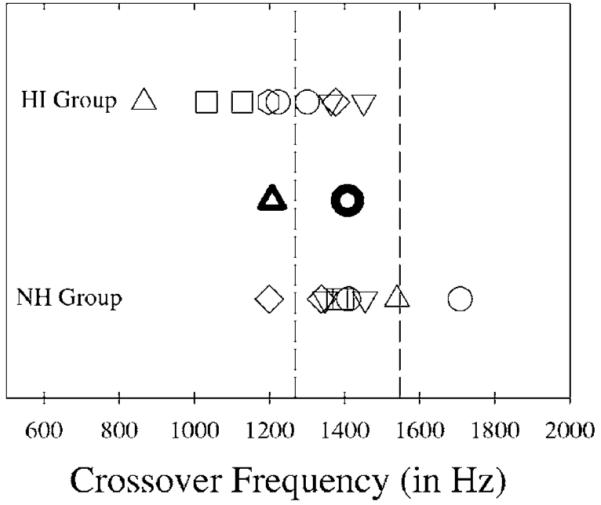
FIG. 2.

Crossover frequency data for NH and HI subjects. The dark circle and triangle represent the average crossover frequency for the NH and HI groups, respectively. The remaining symbols represent individual crossover frequencies for the NH (lower) and HI (upper) groups. Dashed lines show plus or minus 1 standard deviation around the NH mean crossover frequency.
