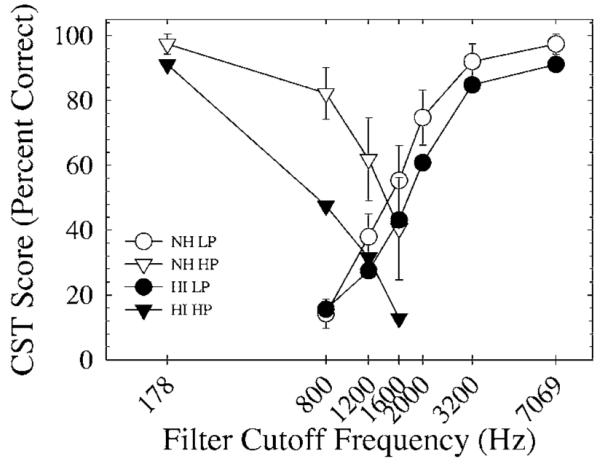
FIG. 3.

Average CST scores for NH and HI participants as a function of low- and high-pass filter cutoff frequency. The filled and unfilled symbols show scores for the HI and NH participants, respectively. The circles and triangles represent scores for low- and high-pass filtering, respectively. Error bars show 1 standard deviation around the NH means.
