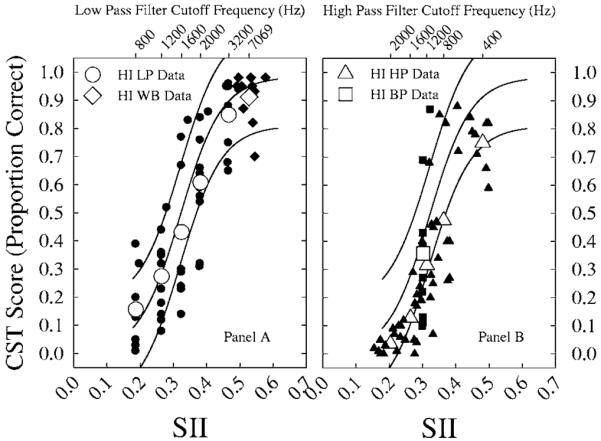
FIG. 5.

Average and individual HI CST performance as a function of SII and filter condition. Performance in the low-pass (circles) and wideband (diamonds) conditions are shown in panel A. Band-pass (800-3150 Hz shown by squares) and high-pass (triangles) performance are shown in panel B. Average and individual performance are shown by the open symbols and filled symbols, respectively.
