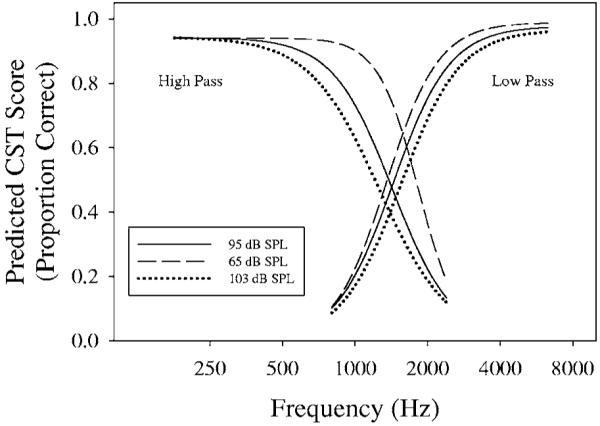
FIG. 8.

Effect of presentation level on crossover frequency. The regression functions shown were derived from fits to SII predicted scores for the CST in multiple low- and high-pass filter conditions. Predictions assume the speech and noise were shaped as in the current study for sloping high-frequency hearing loss and presented at the same SNR as used in this study( +6 dB SNR). The functions were derived assuming speech presentation levels of 65, 95, and 103 dB SPL (measured in a Zwislocki coupler), shown by the dotted, dashed, and solid lines, respectively.
