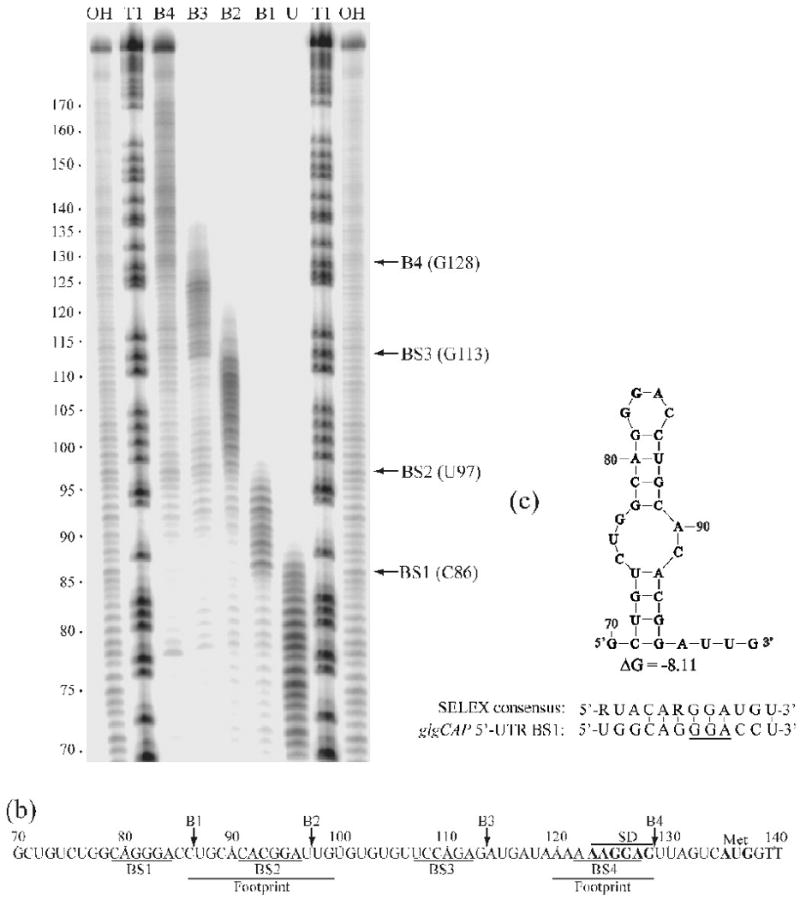
Fig. 6.

Boundary Analysis revealing additional uncharacterized CsrA target sites in the glgCAP 5′-leader. A) Limited alkaline hydrolysis ladders of glg RNA incubated with 1 μM CsrA. CsrA-RNA complexes were separated from unbound RNA on a native gel and subsequently fractionated through a 10% denaturing gel (shown). Lanes corresponding to distinct bound complexes (B1, B2, B3 or B4) and unbound (U) RNA are shown. Lanes corresponding to limited base hydrolysis (OH) and RNase T1 digestion (T1) ladders are indicated. Positions of the boundaries are marked with arrows on the right. Numbering on the left is from the start of glgCAP transcription. b) The glgCAP leader transcript contains four CsrA binding sites (BS1-BS4). Positions of the 3′ boundaries (B1-B4), as well as the previously identified CsrA footprints are shown.37 Positions of the glgC SD sequence and translation initiation codon (Met) are also shown. c) UNAfold model (an algorithm based on Mfold68) of RNA structure that includes BS1 within the single-stranded region of a hairpin loop. Note that hairpins containing BS1 and BS2 will not form simultaneously because they share common stem sequences. ΔG of this structure and a comparison of BS1 with the SELEX-derived CsrA consensus sequence is shown.39
