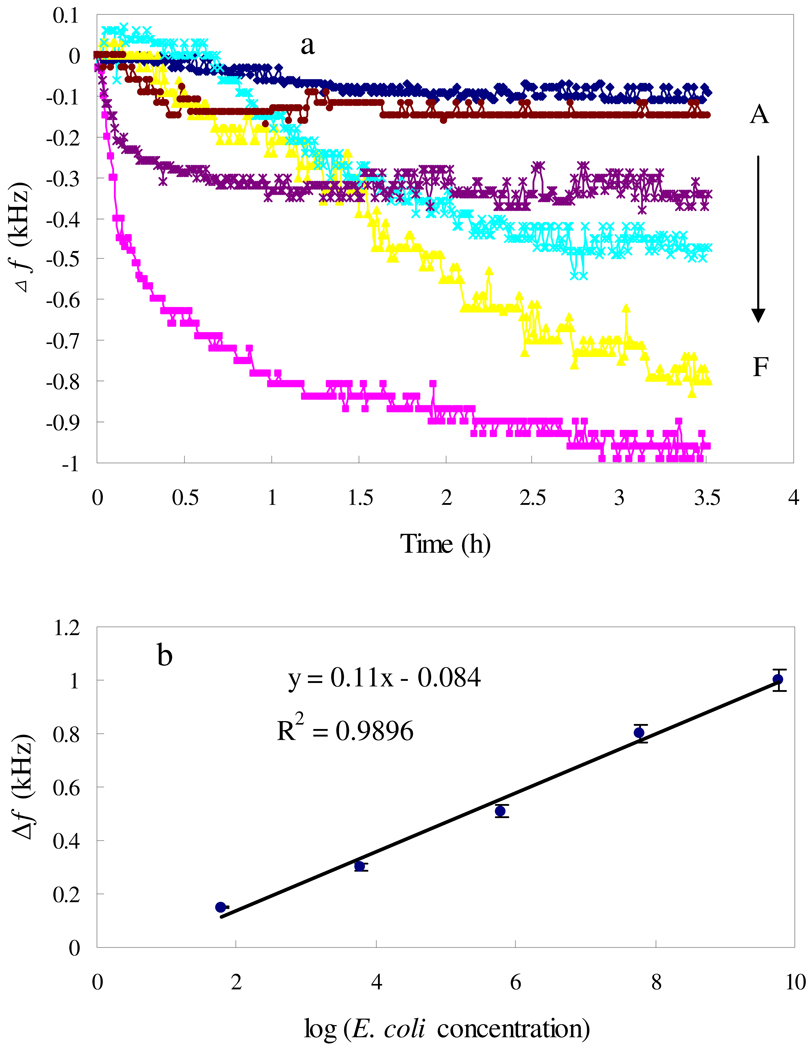
Fig. 6.
The shift of fr in response to various concentrations of E. coli (a): (A) vacant sample; (B)–(F) the E. coli concentrations were 6.0×101, 6.1×10³, 6.1×10⁵, 6.1×10⁷, 6.1×10⁹ cells/mL; (b) Calibration curve: 3 h frequency shifts vs log of E. coli concentrations. 133 nM Con A and 0.303 mM Mn2+/Ca2+ were added to the detection solution.

