
Figure 2.
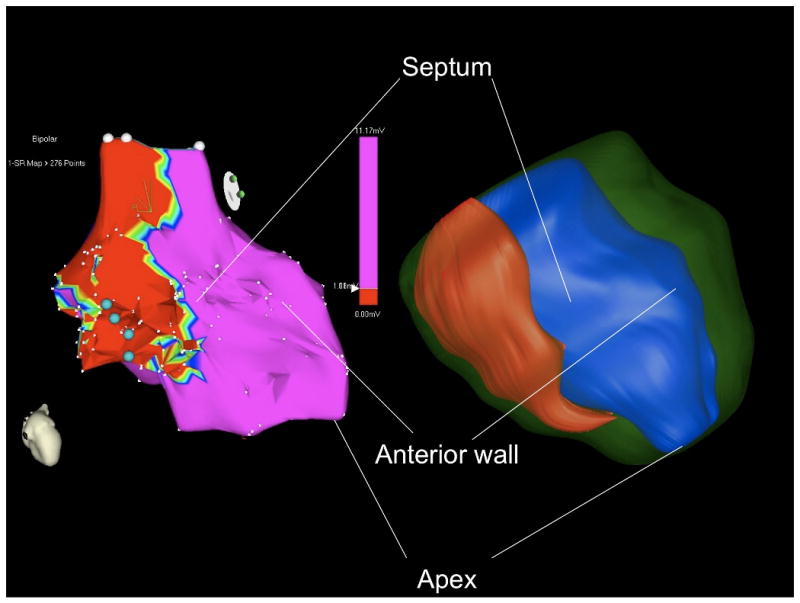
Left: Illustration of a bipolar voltage map using a cut off value of •1.0mV in a patient with prior inferoseptal myocardial infarction (from figure 1). Blue dots indicate critical sites for the targeted VT.
Right: Corresponding three-dimensional surface reconstruction of scar (red), endocardium (blue) and epicardium (green) of the left ventricle based on the MRI contours from figure 1.