
Figure 3.
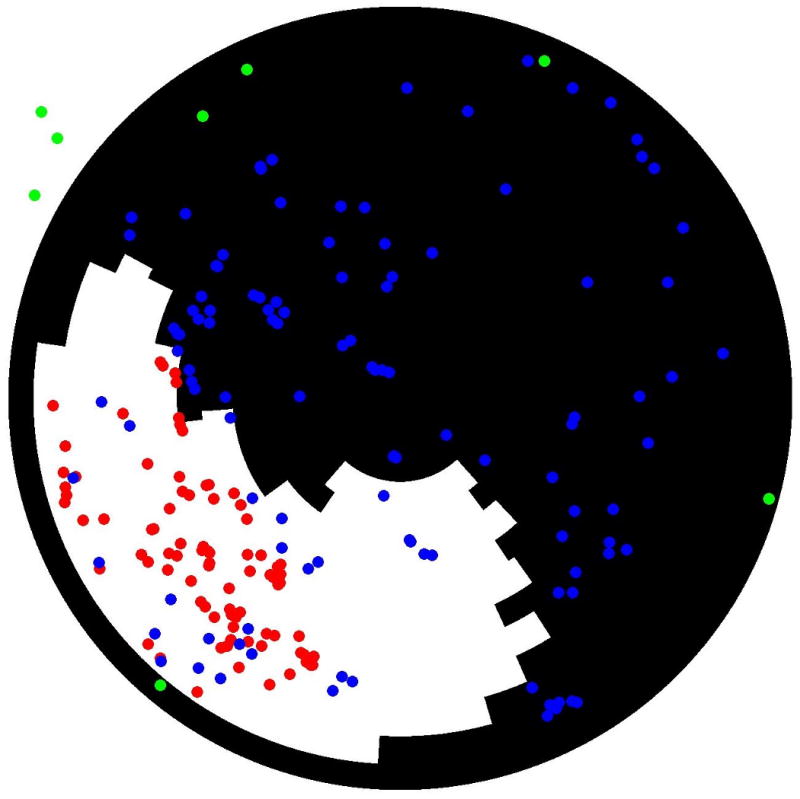
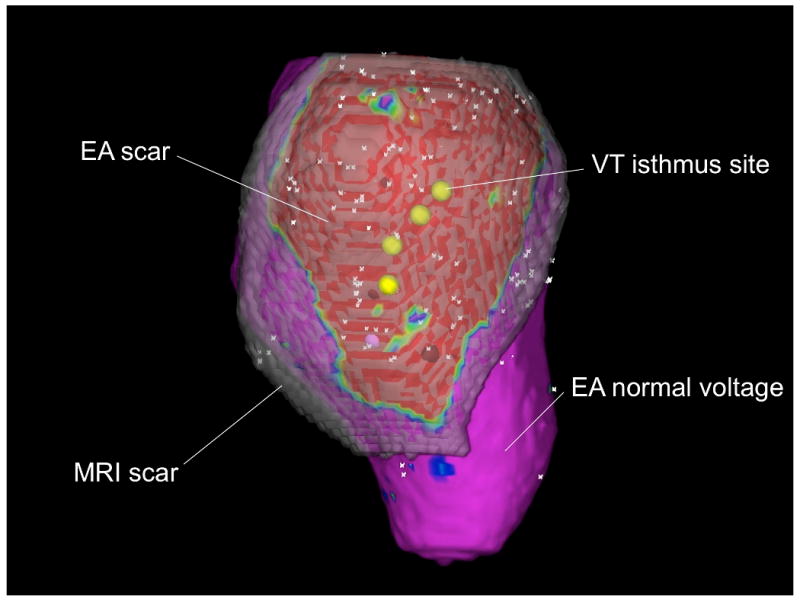
(A) Two-dimensional polar map registration of scar (areas with delayed enhancement in white and normal areas in black) and points obtained from the bipolar electroanatomical map (red tags: sites with voltage •1.0mV; blue tags: areas with voltage >1.0mV; green tags: aortic points and mitral annular points). (B) Three-dimensional registration of scar from figure 1 and 2 into the voltage map from figure 2 (left). The EA map is projected on the MRI endocardial surface. The 3-D MRI scar is in semi-opaque gray. Both the extent and the variation in thickness of the scar on MRI can be appreciated. VT isthmus points are in yellow. Low voltage on the EA map (EA scar) is in red, normal EA voltage is in purple.