
Figure 4.
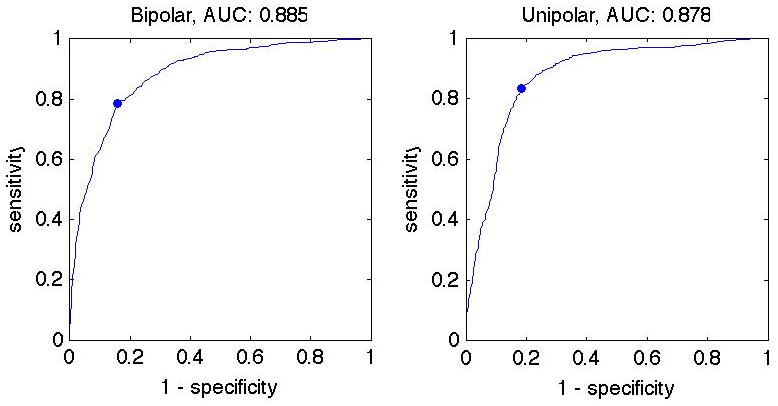
ROC curves for bipolar (left) and unipolar (right) voltages are similar (0.89 vs 0.88). The optimal voltage threshold between normal myocardium and scar was 1.0 mV bipolar (sens. 79%, spec. 84%) and 5.8 mV unipolar (sens. 84%, spec. 81%).
Official websites use .gov
A
.gov website belongs to an official
government organization in the United States.
Secure .gov websites use HTTPS
A lock (
) or https:// means you've safely
connected to the .gov website. Share sensitive
information only on official, secure websites.
ROC curves for bipolar (left) and unipolar (right) voltages are similar (0.89 vs 0.88). The optimal voltage threshold between normal myocardium and scar was 1.0 mV bipolar (sens. 79%, spec. 84%) and 5.8 mV unipolar (sens. 84%, spec. 81%).