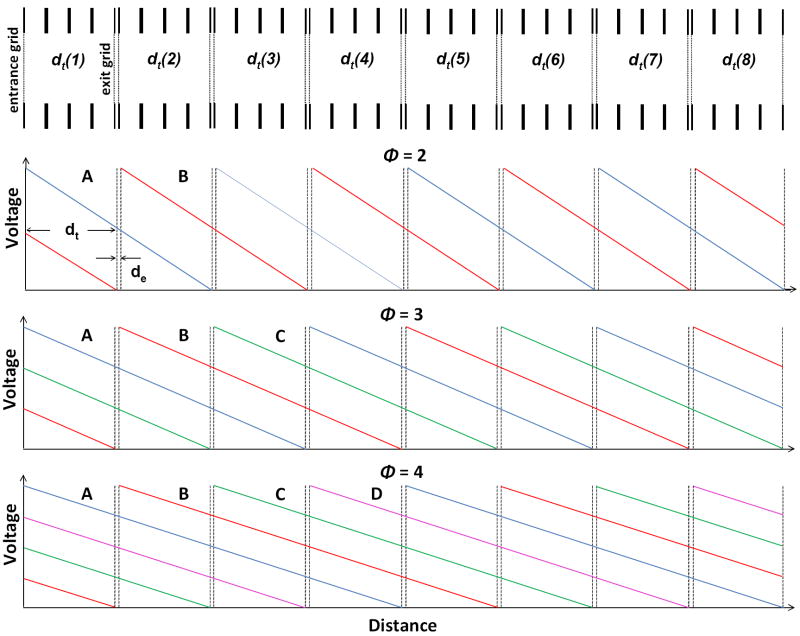
Figure 1.
Illustration of the drift regions of an OMS device. Shown are eight d regions (containing both dt and de sections). Also shown are the field modulation settings for OMS experiments utilizing phase conditions of ϕ = 2, 3, and 4. For the two-phase system, the blue and red traces correspond to voltage settings A and B respectively. For the three-phase system, the blue, red, and green traces correspond with the voltage settings A, B, and C respectively. Finally, for the four-phase system, the blue, red, green, and pink traces correspond with the voltage settings A, B, C, and D.

