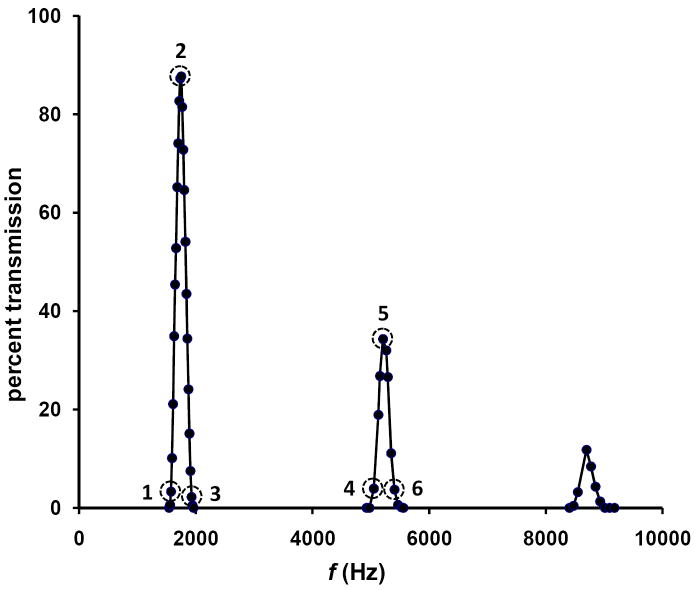
Figure 4.
OMS peak profiles obtained from ion trajectory simulations. Simulations have been performed for an OMS approach utilizing ϕ = 2 and n = 11. Peaks have been modeled for the fundamental frequency as well as the m = 3 and m = 5 harmonic frequencies (2nd and 4th overtones). Dashed-line circles are used to indicate the ion transmission profiles (Figures 5 and 6) of ions in the dt(1) region (Figures 1 and 3) for the given frequency (see text for details).

