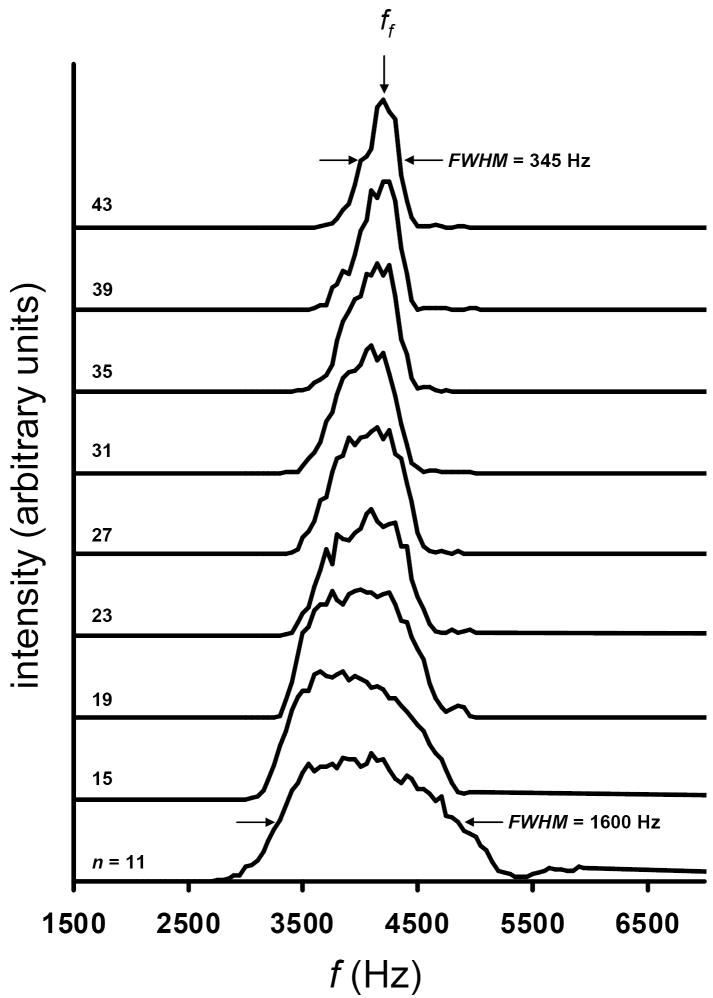
Figure 5.
Experimental OMS distributions for the [M + Na]+ ion for the trisaccharide melezitose. The plots show a progression of OMS distributions as a function of n. The data span the range of that collected using n = 11 d regions (bottom trace) to n = 43 d regions (top trace). The position of ff is shown with an arrow. Additionally, the peak widths (FWHM) for the OMS distributions for n = 11 and n = 43 are noted. Here OMS conditions of ϕ = 4 and m = 1 are utilized. Other experimental conditions include E = 10 V·cm-1 and T = 300 K. lt and le region lengths of 2.83 cm and 0.24 cm, respectively have been used in the experiment.

