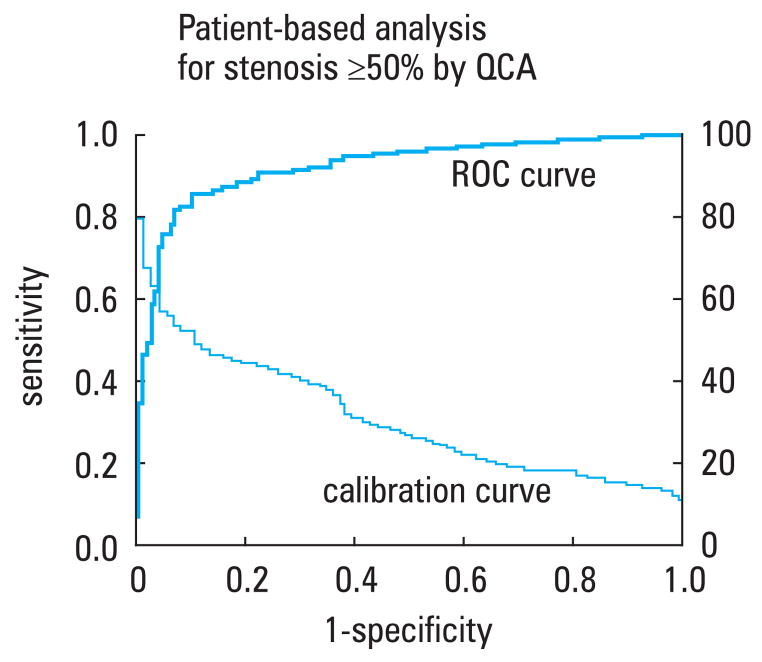
FIGURE 3.
ROC curve (solid line) describing the diagnostic performance of CCTA to identify coronary stenosis of 50% or more in at least one vessel, as compared with invasive quantitative coronary angiography at the level of the patient. The area under the curve was 0.93 (95% CI, 0.90–0.96). The dotted line represents a calibration curve. A corresponding CCTA cutoff point can be determined by extending a vertical line from a point on the ROC curve to the calibration curve and then a horizontal line to the right ordinate, which describes the cutoff point.32
Abbreviations: CCTA – coronary computed tomographic angiography, QCA – quantitative coronary angiography, ROC – receiver-operating-characteristic

