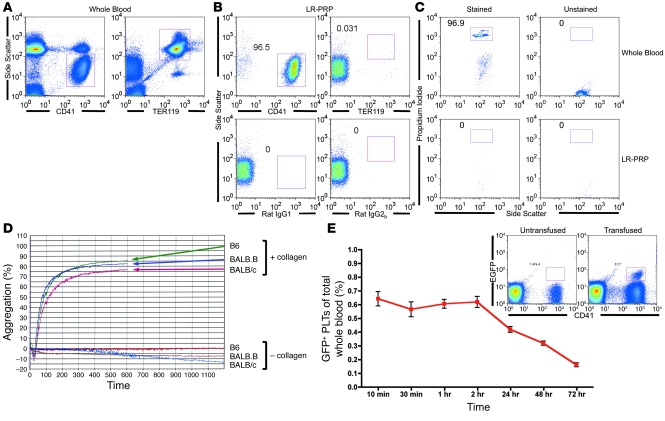
Figure 2. Quality of isolated LR-PLT concentrates.
(A–C) The quantity of PLTs, rbc, and leukocytes was assessed using cell surface markers CD41 and TER119 (A and B) or nucleic acid binding PI (C), respectively. Isotype controls (rat IgG1 for PLTs and rat IgG2b for rbc) and unstained samples were also enumerated to control for nonspecific signal (B and C, respectively). Whole blood samples (A and C) were included for gating purposes. (D) Functionality of isolated PLTs. B6, BALB.B, and BALB/c PLTs were exposed to collagen and measured for percentage of aggregation over time using an aggregometer. PLTs without collagen exposure were included to control for spontaneous aggregation. (E) In vivo survival of LR-PLT products. PLTs from EGFP transgenic mice were transfused into naive B6 recipients and tracked over time. Data represent mean ± SEM. Representative flow cytometry is presented; the left plot utilizes an untransfused mouse to establish background, while the right plot illustrates EGFP+CD41+ PLTs from a transfused recipient. Parts A–C demonstrate the gating strategy used for quantifying each cell subset. Numbers indicate the percentage of the gated population as a function of total events. All panels show representative data from experiments reproduced at least 3 times.

