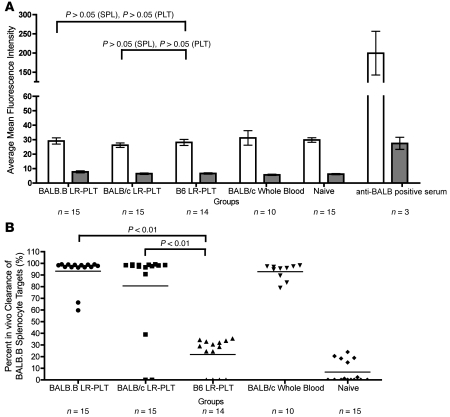
Figure 4. Alloimmunization against BALB mHAs after BMT.
All recipients were B6 Thy1.1 mice (H-2b). (A) Indirect immunofluorescence staining was used to assess the presence of anti-BALB antibodies using BALB.B SPL (white) and PLT (gray) targets. (B) BALB-specific immunity was assessed by in vivo survival of BALB.B SPL targets. Error bars in A represent mean ± SEM. The mean of each group in B is represented as a horizontal line. Statistics were generated using 1-way ANOVA with Dunnett’s post test. Data shown are combined data from 3 separate experiments.

