
Figure 2. HD-1dim cells and HD-1bri cells display a distinct molecular profile.
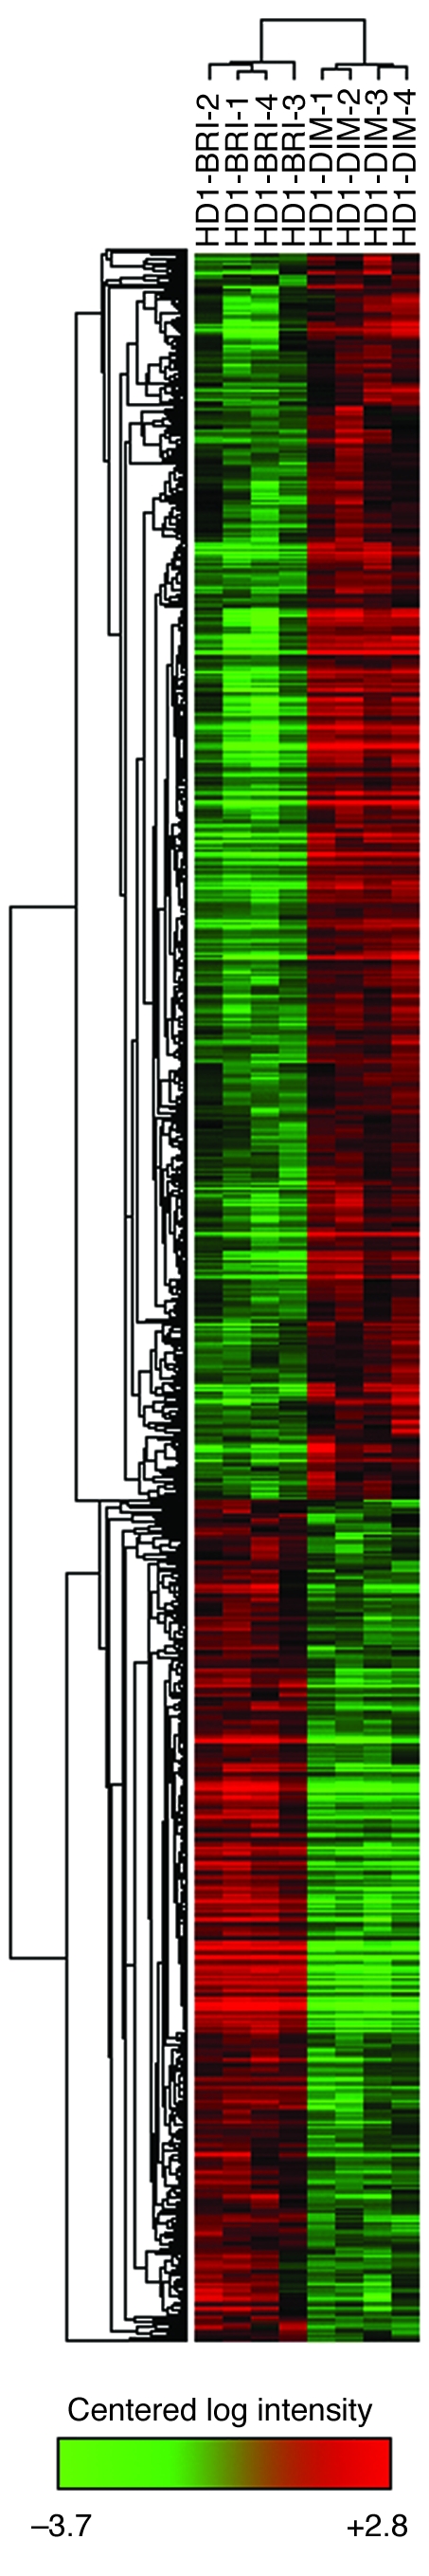
Microarray analyses of neonatal human dermal HD-1bri and HD-1dim populations from 4 independent FACS experiments, visualized using Treeview software, obtained by displaying a hierarchical cluster with average linkage analysis of normalized gene expression (>2-fold change, adjusted P values less than 0.05). These data illustrate the 2,288 probe sets differentially overexpressed (red) or underexpressed (green) in the HD-1bri cells compared with the HD-1dim population. The gene expression patterns are consistent among the 4 replicate experiments.