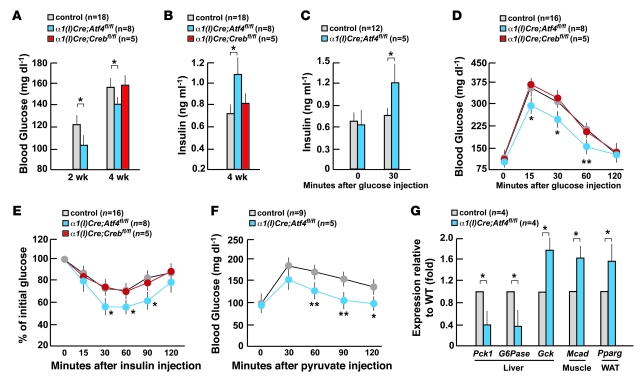
Figure 4. Inactivation of Atf4 only in osteoblasts increases glucose tolerance.
(A and B) Blood glucose and serum insulin levels in Atf4fl/fl [α1(I)Collagen-Cre;Atf4fl/fl (α1(I)Cre;Atf4fl/fl)], and Crebosb–/– [α1(I)Collagen-Cre;Crebfl/fl (α1(I)Cre;Crebfl/fl)] mice at indicated ages. (C) GSIS test in Atf4osb–/– mice. (D and E) GTT and ITT in Atf4osb–/– and Crebosb–/– mice. (F) PTT in Atf4osb–/– mice. (G) Insulin target gene and insulin sensitivity marker gene expression in liver, muscle, and white adipose tissue of Atf4osb–/– mice. Analysis of 4-week-old Atf4osb–/– and Crebosb–/– mice is shown in C–G. Error bars show mean + SEM. **P < 0.01; *P < 0.05, WT versus Atf4osb–/– mice.

