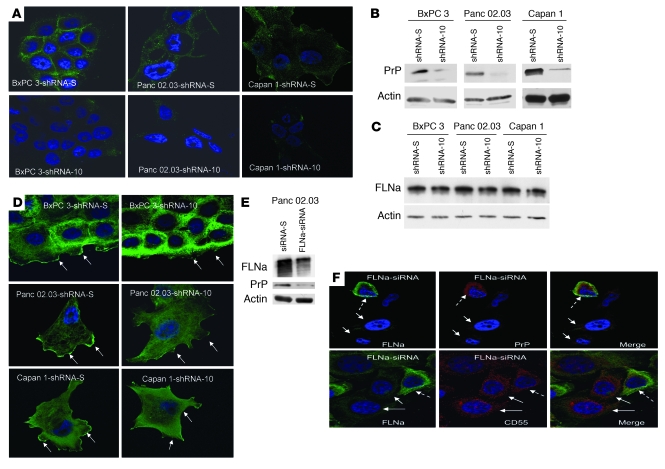
Figure 4. Downregulation of PrP or FLNa expression in the PDAC cell lines.
(A) Immunofluorescence staining and confocal microscopic images show the PDAC cell lines with shRNA-10 have reduced levels of PrP. Original magnification, ×1,000. (B) Immunoblots show the PrP-downregulated shRNA-10 cells have reduced levels of PrP. (C) Immunoblots show the level of FLNa does not change in PrP-downregulated cells. (D) Immunofluorescence staining and confocal microscopic images show that knocking down PrP alters the spatial distribution of FLNa. Arrows show staining of membrane ruffles and leading edges. Original magnification, ×1,000. (E) Immunoblots show that when expression of FLNa is inhibited, the expression of PrP is also reduced in Panc 02.03 cells. (F) Immunofluorescence staining and confocal microscopic images show the expression of FLNa modulates PrP but not CD55 expression. In the top left panel, the dashed arrow identifies a cell with FLNa (green); solid arrows identify 2 cells lacking FLNa. In the top center panel, 2 solid arrows identify 2 cells lacking PrP; the dashed arrow identifies 1 cell with PrP (red). The top right panel is the merge of the left and center panels; 2 arrows identify 2 cells lacking both PrP and FLNa, and a dashed arrow identifies 1 cell with both PrP and FLNa. In the bottom panels, 2 FLNa-negative cells (left panel, solid arrows) still express high levels of CD55 (red; center panel, solid arrows), although some cells have both FLNa and CD55 stain (left and center panels, dashed arrows). Original magnification, ×1,000.

