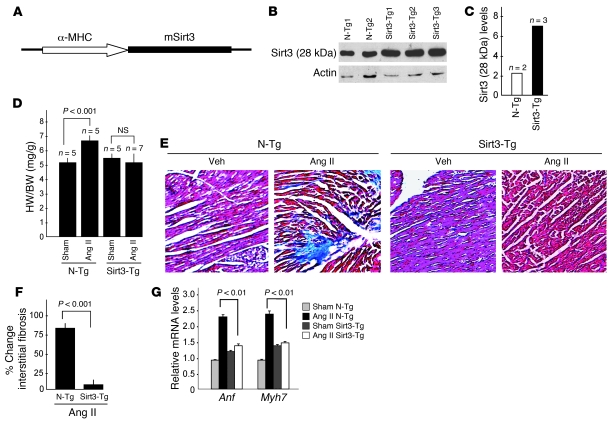
Figure 3. Sirt3-Tg mice are protected from agonist-mediated cardiac hypertrophy.
(A) A schematic of Tg construct used to generate mSirt3-Tg mouse lines. (B) Sirt3 (28 kDa) expression analysis in 2 N-Tg and 3 Sirt3-Tg mouse lines. (C) Quantitative analysis of expression of Sirt3 (28 kDa) in N-Tg and Sirt3-Tg mice lines. (D) N-Tg and mSirt3-Tg mice were treated with either vehicle (Sham) or Ang II (3.0 mg/kg per day for 14 days), and their HW/BW ratios were determined. (E) Representative heart sections stained with Masson’s trichrome for detecting fibrosis in N-Tg and Sirt3-Tg mice subjected to Ang II–mediated hypertrophy. Original magnification, ×40. (F) Quantification of fibrosis in N-Tg and Sirt3-Tg mouse hearts after Ang II treatment. (G) ANF and Myh7 mRNA levels in hearts of N-Tg and Sirt3-Tg mice treated with either vehicle (Sham) or Ang II. Values indicate relative expression levels to sham-operated group (mean ± SEM; n = 5 [D, F, and G]).

