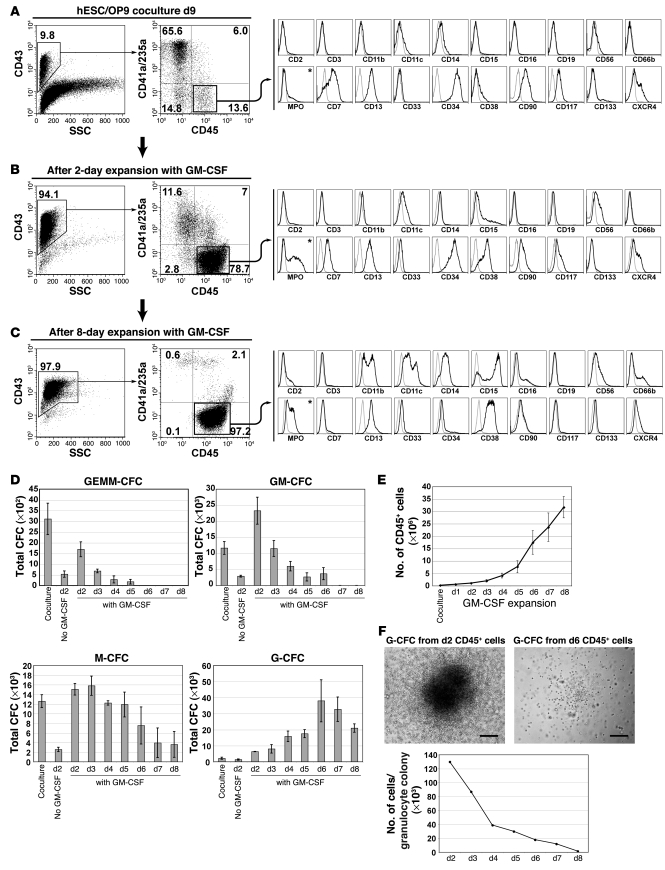
Figure 2. Characterization of H1 hESC–derived myeloid progenitors generated in OP9 coculture and expanded with GM-CSF.
Phenotype of CD235a/CD41a–CD45+ cells generated on day 9 (d9) of hESC/OP9 coculture (A) and after 2 (B) and 8 days (C) expansion with GM-CSF; the asterisk indicates intracellular staining. A representative of 3–5 independent experiments is shown. SSC, side scatter. Values within dot plots indicate the percentage of cells in the respective quadrants. (D) Absolute number of myeloid CFCs generated from one 10-cm dish of hESC/OP9 coculture and from CD235a/CD41a–CD45+ cells obtained from the same dish and expanded in the presence of GM-CSF for 2–8 days. Results are mean ± SEM of 3–5 independent experiments. (E) Kinetics of CD235a/CD41a–CD45+ cell expansion with GM-CSF. Data are expressed as the number of CD235a/CD41a–CD45+ cells generated from one 10-cm dish of hESC/OP9 coculture and following expansion with GM-CSF. Results are mean ± SEM of 3–5 experiments. (F) Typical morphology of granulocytic colony obtained from CD235a/CD41a–CD45+ cells expanded with GM-CSF for 2 and 6 days (scale bars: 100 μm). The graph shows cell numbers per single granulocytic colony obtained from cells expanded with GM-CSF for 2–8 days.

