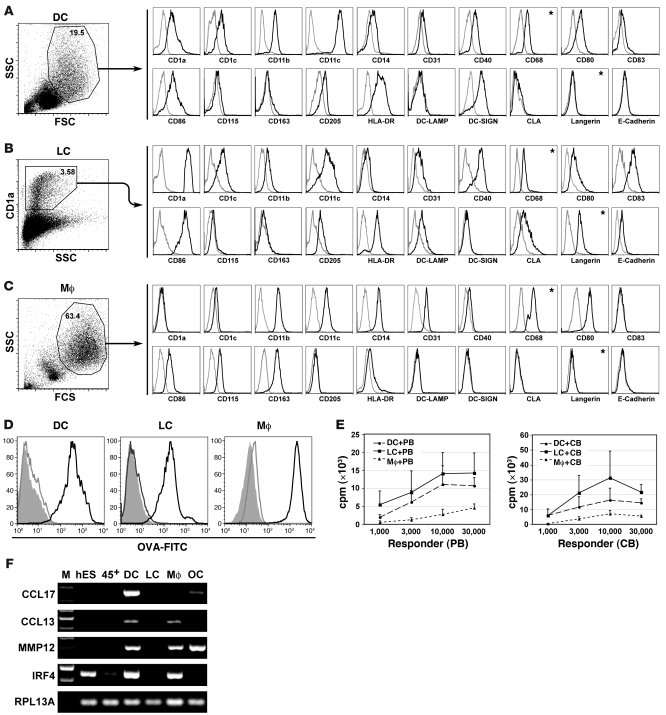
Figure 5. Phenotypic, molecular, and functional analysis of H1 hESC–derived DCs, LCs, and macrophages obtained from isolated CD235a/CD41a–CD45+ cells after 2 days expansion with GM-CSF.
FACS analysis of hESC-derived DCs (A), LCs (B), and macrophages (C). Plots show isotype control (gray) and specific antibody (black) histograms; asterisks indicate intracellular staining. Values within dot plots indicate the percentage of cells within the corresponding gate. A representative of 5–10 independent experiments is shown. (D) FACS analysis of OVA uptake and processing by hESC-derived antigen-presenting cells. Plots show isotype control (open gray), cells incubated at 4°C (filled gray; nonspecific binding control), and 37°C (open black) histograms. (E) Allogeneic stimulatory capacity of hESC-derived antigen-presenting cells. PB, peripheral blood lymphocytes; CB, cord blood lymphocytes. Results are mean ± SEM of 3 independent experiments performed in triplicate. (F) RT-PCR analysis of gene expression in hESC-derived antigen-presenting cells. Mϕ, macrophages; OC, osteoclasts.

