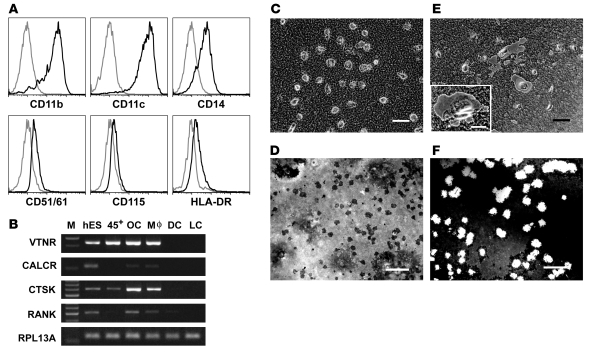
Figure 6. Phenotypic, molecular, and functional analysis of H1 hESC–derived osteoclasts.
(A) FACS analysis of hESC-derived osteoclasts. A representative of 3 independent experiments is shown. (B) RT-PCR analysis of gene expression in hESC-derived osteoclasts. Analysis of mineralized matrix–resorptive capacity of hESC-derived macrophages (C and D) and osteoclasts (E and F) using BioCoat osteologic discs. Resorption lacunae around multinucleated cells are clearly visible in osteoclasts cultures (E, inset) but not in cells cultured with M-CSF and IL-1β (C). Visualization of resorption lacunae in macrophage (D) and osteoclast (F) cultures with von Kossa staining. Scale bar: 200 μm (C–F).

