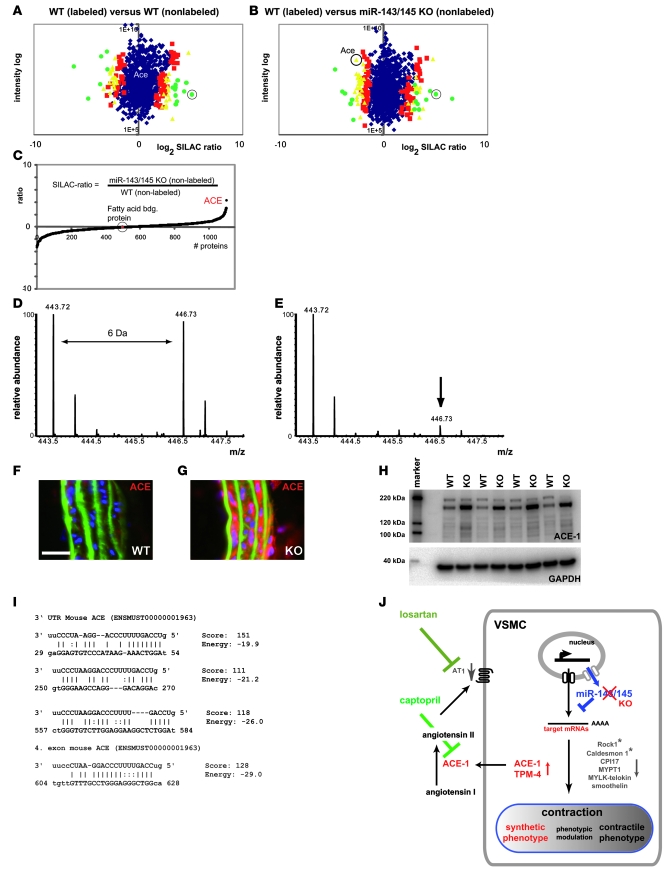
Figure 6. ACE is a target of miR-145.
Analysis of protein expression by SILAC mouse–based quantitative proteomics and Western blot analysis. (A and B) SILAC-labeled (13C6Lys) WT aorta was mixed with nonlabeled WT aorta (A) and miR-143/145 KO aorta (B). Protein ratios are plotted against added peptide intensities. Blue dots represent proteins that do not show a significant change in expression levels (P ≥ 0.05). Red, yellow, and green dots represent proteins with a significant change in expression levels at different confidence intervals (red: P < 0.05, yellow: P < 0.01, green: P < 0.001). Circled green dots in A and B indicate fatty acid–binding protein. (C) To obtain ratios between nonlabeled WT and nonlabeled Mir143/145-KO aortae, both ratios from 13C6Lys-WT/WT (nonlabeled) and 13C6Lys-WT/miR-143/145 KO (non-labeled) were divided by each other. (D and E) Mass spectra of an ACE-1 peptide [YVEFSNK (MH2+)] SILAC pair with 13C6Lys-WT/WT (D) and a pair 13C6Lys-WT/Mir143/145-KO (E). Peaks with lower molecular weight correspond to the unlabeled peptide; peaks with higher molecular weight (greater than 6 Da) correspond to the 13C6Lys peptide. Calculation of ACE-1 signals from all samples revealed a 4.9-fold upregulation of ACE-1 in KO vs. WT aortae (n = 3 per genotype, P < 0.01; see Supplemental Table 1). (F and G) Immunofluorescence analysis of ACE expression in cryosections of aorta (scale bar: 25 μm). (H) Western blot analysis of ACE-1 expression in WT and Mir143/145-KO aortae (n = 4 per genotype, P < 0.001, KO/WT ratio: 4.3). (I) miR-145 binding sites in the 3ι UTR and ORF of ACE predicted by the miRanda algorithm. (J) Schematic representation of the role of miR-143/145 in VSMCs.

