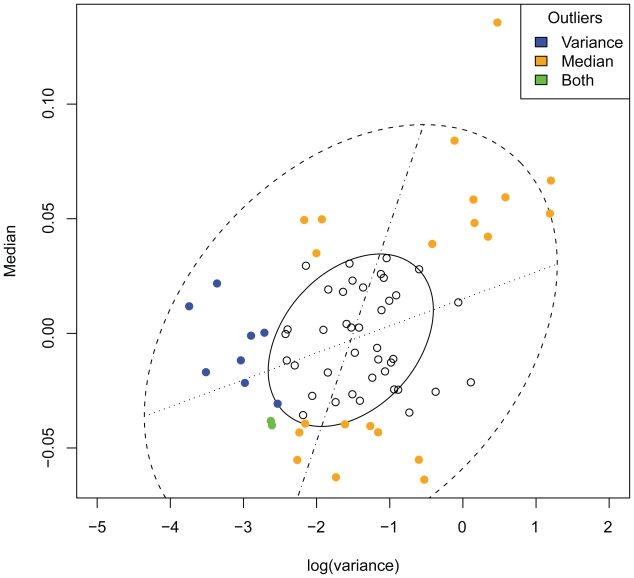
Figure 1.
Outlier removal. Median vs. log (variance) plot of all 76 contrasts and the associated bivariate box plot, colors indicate the type of outlier (see legend). The bivariate box plot is the two-dimensional analog of the familiar box plot of univariate data and consists of a pair of concentric ellipses, the hinge and the fence (Everitt 2005). This box plot is based upon a robust estimator for location, scale and correlation. Uncolored contrasts were kept for further analysis.

