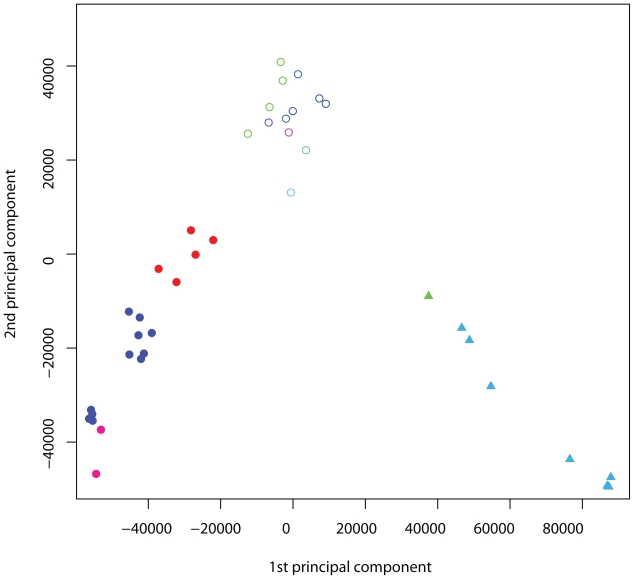
Figure 2.
Kernel PCA on 41 Arabidopsis thaliana contrasts. Plot of all 41 contrasts using the first two principal component axes. Comparisons are colored according to the experiment they originated from and correspond to the colors used in Figure 3, different shapes indicate the three different clusters obtained from spectral clustering: Indole-3-acetic acid (IAA) related contrasts (solid circle), pathogen related contrasts (triangles) and others (outlined circle).

