Figure 5.
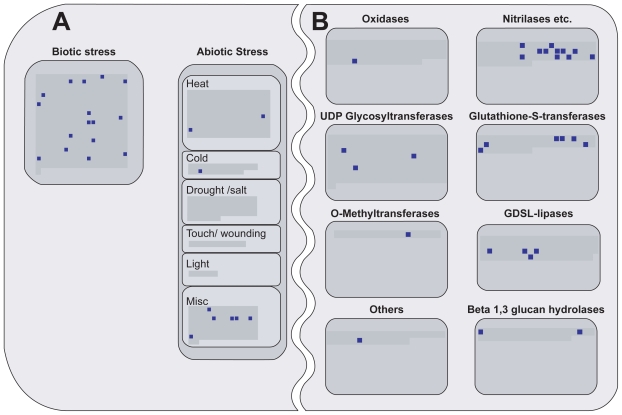
Overview of (A) stress genes and (B) genes of large enzyme families regulated in pathogen-associated contrasts. The gray areas inside the individual diagrams of the functional categories represent all genes present on the ATH1 chip. Dark blue squares indicate regulated genes. Subcategories “Biotic Stress” (A) and “Nitrilases etc.” (B) contain a high number of genes regulated after pathogen exposure.
The figure is based on maps from the pathway analysis program MapMan (Usadel et al. 2005).

