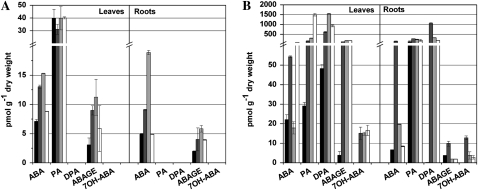
Figure 5.
Endogenous levels of ABA and its derivatives in untreated maize roots and leaves (black bars) and tissues exposed to osmotic stress (dark gray bars), salinity stress (light gray bars), and exogenous BAP application (white bars) for 0.5 h (A) and 72 h (B). All bars show mean values of two replicates with indicated sd. DPA, Dihydrophaseic acid; PA, phaseic acid.

