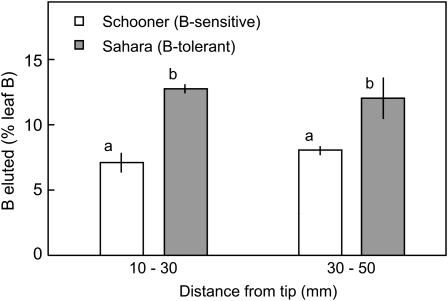
Figure 6.
Elution of B from leaves of Sahara (B-tolerant) and Schooner (B-sensitive) barley over 6 min following infiltration and centrifugation of 10-mm leaf segments. Each value is the mean ± se of five determinations. Columns with different letters indicate significant differences between means (P < 0.05).

