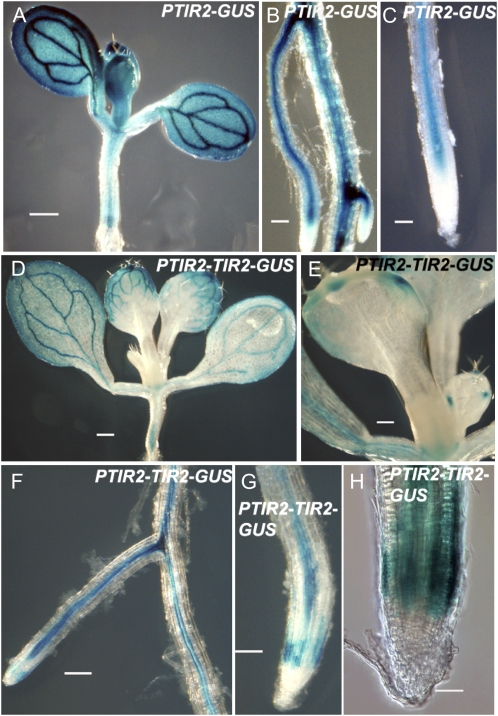
Figure 5.
Analysis of TIR2 expression in pTIR2:GUS and pTIR2:TIR2-GUS lines. GUS staining in pTIR2:GUS (A–C) and pTIR2:TIR2-GUS tir2-1 (D–H) seedlings. Bars = 1 mm in A, 125 μm in B, C, F, and G, 500 μm in D, 250 μm in E, and 50 μm in H. Eight-day-old seedlings (A), 6-d-old seedlings (B and C), and 9-d-old seedlings (D–H) are shown.

