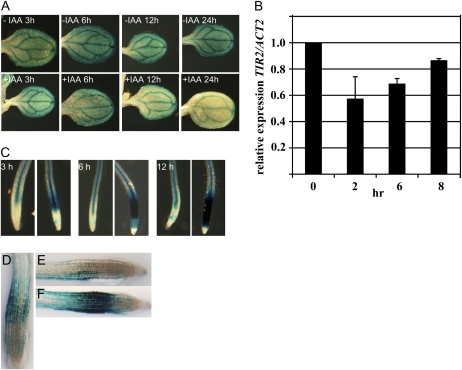
Figure 6.
Regulation of TIR2 by auxin. A, GUS staining of pTIR2:TIR2-GUS seedlings at intervals after treatment with 10 μm IAA. B, Relative TIR2 RNA levels in aerial plant parts after treatment with 50 μm IAA measured by quantitative RT-PCR. TIR2 levels at time 0 were set to 100%. Values are the mean of eight determinations from three independent RNA preparations. Error bars represent sd. C, GUS staining of pTIR2:TIR2-GUS seedlings after treatment with 10 μm IAA for 3, 6, and 12 h. D to F, GUS staining of pTIR2:TIR2-GUS before (D) and 8 h after 90° rotation (E and F). Seedling in F was treated with 50 μm NPA.

